Binaural beats: what the neuroscience actually says
Written by Jordan Elias, MT-BC
Binaural beats are much talked-about tools in the wellness space and possibly a bit misrepresented. The phenomenon is real, the neuroscience is interesting, and the claims made about it are mostly not supported by evidence. This post explores all of that.
What a binaural beat actually is
Play a pure tone at 200 Hz into your left ear and a slightly different tone at 210 Hz into your right ear. Because the two tones arrive at different ears rather than through the same speaker or the air, your auditory system detects the difference between them. The result is a perception of a third tone pulsing at 10 Hz. That pulse is the binaural beat.1 Specifically, this happens in a region called the superior olivary complex in the brainstem, which is one of the first places where input from both ears is combined, allowing your brain to compare the two separate signals.2
This is a genuine auditory phenomenon with a clear neurological basis.1 The base tone that both ears receive versions of, or the carrier frequency, determines the pitch you hear. The beat frequency is then the difference between the two tones.3 This determines the rate of the perceived pulse. In the generator above, the left ear always receives the carrier frequency exactly, and the right ear receives the carrier plus the beat frequency. The information display updates in real time to show you both frequencies and the beat.
One important constraint: this only works with headphones. If you play the two tones through speakers in a room, they mix physically in the air before reaching your ears and the binaural effect disappears. What you hear instead is a regular acoustic beat, which is a different phenomenon.4
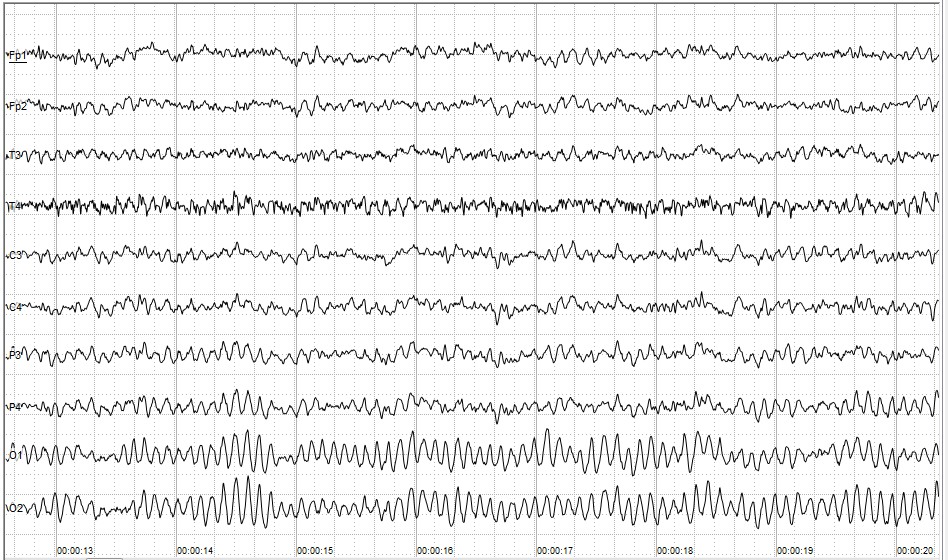
EEG signal at resting state. Each wave corresponding to an electrode placed on the scalp. By Andrii Cherninskyi.
How EEG works
To understand the claims made about binaural beats, you first need to understand what EEG is and what it actually measures. Electroencephalography places small electrodes on the scalp to measure electrical activity generated by the brain.5 There are typically between 16 and 256 of them in research settings, fewer in consumer devices.6 The electrodes record tiny fluctuations in electrical voltage. These fluctuations are on the order of microvolts, roughly a million times smaller than a household battery, which is one reason the equipment requires careful amplification and shielding from electrical interference.7
What generates this signal? The brain contains approximately 86 billion neurons.8 A single neuron firing produces an electrical pulse far too small to be detected at the scalp. What EEG picks up is the summed electrical activity of large populations of tens of thousands to millions of neurons, all firing in rough synchrony beneath the electrode.9 When neurons in a region cycle through their activity in a coordinated rhythm, the resulting oscillation can be measured at the scalp as a wave. The frequency of that wave reflects the rate of the oscillation. The amplitude reflects how synchronised and how many neurons are participating.9
This is the first important limitation to hold in mind: EEG does not measure individual neurons, specific thoughts, or localised activity. It measures the collective electrical rhythm of large populations, mostly near the surface, and distorted by the time it has passed through brain tissue, cerebrospinal fluid, skull, and scalp.10 EEG has excellent temporal resolution though. It can track changes at the millisecond level, faster than any other non-invasive brain imaging technique.11 But its spatial resolution is poor. For precise localisation of activity you need fMRI, which measures blood flow changes rather than electrical fields and can pinpoint activity within a few millimetres.12
One of the clearest examples of how EEG actually works is the auditory N1, sometimes written N100. When a sound occurs, the auditory cortex produces a characteristic negative voltage deflection measurable at the scalp, peaking at roughly 100 milliseconds after the sound's onset.13 It is one of the most reliably observed responses in the entire EEG literature and reflects the brain's initial cortical processing of an auditory event.13 The N1 is not visible in a single trial.14 If you were to record a single tone and look at the EEG trace immediately after, you would still see mostly noise.
The N1 is buried within the continuous background electrical activity of the brain doing everything else it is doing. To make it visible, researchers present the same sound dozens or hundreds of times and average together the EEG traces across all the trials.14 Because the N1 occurs at a consistent latency relative to the sound onset, it survives the averaging process. All the random, unrelated neural activity like small muscle movements averages toward zero. What remains is the event-related potential: the component of the brain's electrical activity that is consistently time-locked to the stimulus.14 This averaging procedure is fundamental to ERP research and it illustrates something important about what EEG is actually measuring.14
With that in mind, here are the major EEG frequency bands and what they are currently understood to reflect:
| band | frequency | associated states |
|---|---|---|
| delta | 0.5 – 4 Hz | Deep dreamless sleep. Large cortical regions cycling slowly and synchronously, essentially offline from sensory input. Strong delta in a waking adult may indicate pathology. |
| theta | 4 – 8 Hz | Drowsiness, the hypnagogic state between waking and sleep, and certain meditative states. The hippocampus generates robust theta rhythms during spatial navigation and memory encoding. This is one of the better-characterised functional roles of a specific EEG band. |
| alpha | 8 – 13 Hz | Relaxed wakefulness, strongest over the occipital cortex with eyes closed. During a phenomenon called event-related desynchronisation, alpha tends to decrease when a region is actively processing and increase when it is disengaged. One of the most reliably replicated findings in EEG research. |
| beta | 13 – 30 Hz | Active waking cognition, focused attention, motor preparation, and engaged sensory processing. Elevated beta is associated with alert, effortful states. Some research links high beta with anxiety, though this relationship is complex and context-dependent. |
| gamma | 30 – 100 Hz | High-level perceptual binding, the process by which the brain integrates information across regions into a unified percept. Also observed during intense concentration and some meditative states. Methodologically challenging to measure cleanly because muscle artifact from the scalp contaminates the same frequency range. |
These bands are useful descriptive categories but they are not fixed states with clean boundaries. The brain does not switch between them like modes on a device. Multiple bands are active simultaneously, their relative power shifts continuously, and the relationship between a measured frequency band and a psychological state is probabilistic and context-dependent, not deterministic.10
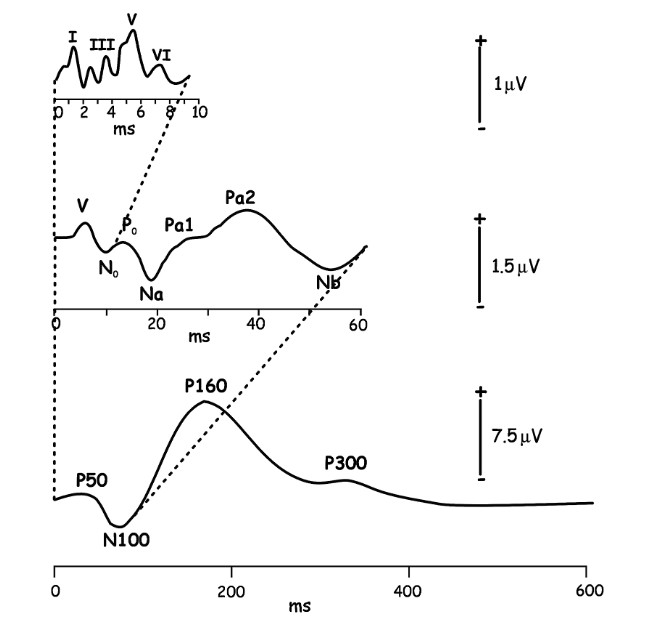
Typical sequence of auditory sensory components. The waveform elicited by a click stimulus shown over different time ranges. At top, the auditory brainstem responses, middle, the mid-latency responses, and bottom, the long-latency responses. Adapted from Pratt (2012). Copyright 2012 Oxford University Press.
The entrainment claim
Neural entrainment is a real phenomenon. It refers to the tendency of an oscillating biological system to synchronise with an external rhythmic stimulus.15 Motor systems entrain to a beat. This is why you tap your foot to music.16 Heart rate and respiration can show rhythmic coupling with external stimuli under certain conditions. The question is whether cortical EEG oscillations entrain to an auditory stimulus delivered binaurally, and whether this can be used to reliably drive the brain into a target state.
The claim made by most binaural beat products is straightforward: a 10 Hz beat will push your brain into alpha, a 4 Hz beat into theta, and so on. The mechanism proposed is that the superior olivary complex generates a neural oscillation at the beat frequency which then propagates through the auditory system and entrains the cortex.
The research picture is considerably more complicated. There are studies showing small increases in EEG power in the target frequency band during binaural beat exposure. However these effects are modest and inconsistent across studies.17 The more critical problem is the confound of general relaxation: lying still in a quiet room with headphones on will produce alpha regardless of what is playing, simply because reduced sensory engagement and reduced motor activity are among the most reliable ways to increase alpha power.18 The studies that have attempted to control for this by using active control conditions such as monaural beats or broadband noise at the same volume. However, they tend to show much weaker or null effects on EEG.
There is also a basic mechanistic problem. The binaural beat is perceived as a low-frequency pulse, but it is not a low-frequency sound wave. It is a 200 Hz signal with a 10 Hz amplitude modulation envelope. The auditory system processes this differently from a true low-frequency stimulus.1 Whether the neural response to this modulated signal is sufficient to drive cortical entrainment at 10 Hz is not established.
What can be said with more confidence: binaural beats are relaxing for many people, particularly when combined with ambient sound and used in a quiet environment with intention. Whether this relaxation is driven by specific neural entrainment or by the same factors that make any quiet, low-stimulation rest period beneficial is an open question.17 The experience is real. The specific mechanism claimed for it is not well supported.
Using the generator
Listening with attention
Start with the focus preset and press play with headphones. The beat should be clearly perceptible as a gentle pulse inside your head rather than in your ears. Let it run for two or three minutes before forming any impression. Notice whether the experience is pleasant, neutral, or uncomfortable. Notice where in your body you feel it, if anywhere.
Then try calm. The beat frequency drops to the theta range. The pulse is slower, more spaced out. Does the character of the experience change? Does the slower rate feel different from the faster one, and if so, in what way? Try to distinguish between what is genuinely different about the sound and what your expectation of a "calm" label is contributing.
Isolating the expectation effect
This is a version of the priming experiment from the timbre lab. Set a beat frequency of 10 Hz manually without using a preset. Listen for one minute. Then apply the focus preset, which uses the same frequency. Notice whether having a label changes anything about your experience of an identical sound. This is not about catching yourself being fooled. It is about observing directly how strongly the interpretive frame shapes the percept.
Ambient layering
Try the same preset with each ambient setting. Brown noise has more energy in the low frequencies than pink noise and many people find it warmer and more enveloping. Notice which combination feels most natural for sustained listening. The ambient layer has no binaural properties — it is the same in both ears — but it substantially changes the overall character of the experience. At what ambient volume does the beat become less salient? At what point does it disappear entirely into the background?
A note on therapeutic use
Binaural beats appear in clinical and wellness contexts primarily as an adjunct to relaxation practices, often used alongside breathwork, body scanning, or meditation rather than as a standalone intervention. In that context the evidence for general relaxation benefits is more credible, since the active components are likely the quiet environment, the intentional rest, and the directed attention rather than the specific beat frequency.
From a music therapy perspective, the more interesting question is not whether a 10 Hz beat reliably produces alpha, but what the experience of directed listening to a subtle auditory phenomenon does to a person's quality of attention. The beats give the listener something very small and internal to track, and that requires concentration to detect clearly, and that shifts as the parameters change. For some people this functions as a useful anchor for attention in the same way breath does in meditation practice. This is not something I generally use in my practice, but if it feels useful for you, that's a good thing.
If this resonates
This post is part of a series exploring sound, perception, and neuroscience through interactive tools you can use directly in the browser. The timbre lab covers how overtone structure shapes emotional experience.
If you are curious about what music therapy grounded in neuroscience and careful listening looks like in practice, you can learn more on the music therapy page. I work with musicians, neurodivergent individuals, and people navigating significant life transitions. Music experience is not required.
I offer a free 30-minute consultation where we can explore the possibility of working together.
References
- Oster, G. (1973). Auditory beats in the brain. Scientific American, 229(4), 94–102.
- Pickles, J. O. (2012). An introduction to the physiology of hearing (4th ed.). Emerald.
- Licklider, J. C. R. (1951). A duplex theory of pitch perception. Experientia, 7(4), 128–134.
- Perrott, D. R., & Nelson, M. A. (1969). Limits for the detection of binaural beats. Journal of the Acoustical Society of America, 46(6), 1477–1481.
- Niedermeyer, E., & da Silva, F. L. (2005). Electroencephalography: Basic principles, clinical applications, and related fields (5th ed.). Lippincott Williams & Wilkins.
- Kappenman, E. S., & Luck, S. J. (2010). The effects of electrode impedance on data quality and statistical significance in ERP recordings. Psychophysiology, 47(5), 888–904.
- Luck, S. J. (2014). An introduction to the event-related potential technique (2nd ed.). MIT Press.
- Azevedo, F. A. C., et al. (2009). Equal numbers of neuronal and nonneuronal cells make the human brain an isometrically scaled-up primate brain. Journal of Comparative Neurology, 513(5), 532–541.
- Schaworonkow, N., & Nikulin, V. V. (2019). Spatial neuronal synchronization and the waveform of oscillations: Implications for EEG and MEG. PLOS Computational Biology, 15(5), e1007055.
- Nunez, P. L., & Srinivasan, R. (2006). Electric fields of the brain: The neurophysics of EEG (2nd ed.). Oxford University Press.
- Carlson, T. A., Grootswagers, T., & Robinson, A. K. (2019). An introduction to time-resolved decoding analysis for M/EEG. Journal of Cognitive Neuroscience Methods.
- Logothetis, N. K. (2008). What we can do and what we cannot do with fMRI. Nature, 453, 869–878.
- Näätänen, R., & Picton, T. (1987). The N1 wave of the human electric and magnetic response to sound. Psychophysiology, 24(4), 375–425.
- Luck, S. J. (2014). An introduction to the event-related potential technique (2nd ed.). MIT Press.
- Thaut, M. H., McIntosh, G. C., & Hoemberg, V. (2015). Neurobiological foundations of neurologic music therapy: Rhythmic entrainment and the motor system. Frontiers in Psychology, 5, 1185.
- Repp, B. H., & Su, Y. H. (2013). Sensorimotor synchronization: A review of recent research. Psychonomic Bulletin & Review, 20, 403–452.
- García-Argibay, M., Santed, M. A., & Reales, J. M. (2019). Efficacy of binaural auditory beats in cognition, anxiety, and pain perception: A meta-analysis. Psychological Research, 83, 357–372.
- Barry, R. J., Clarke, A. R., Johnstone, S. J., Magee, C. A., & Rushby, J. A. (2007). EEG differences between eyes-closed and eyes-open resting conditions. Clinical Neurophysiology, 118, 2765–2773.